
What DataWeaver does
A data warehouse holds the history of a business: every sale, every product, every branch. Getting an answer out of one normally means writing a question in a language called SQL. DataWeaver writes that question for you. People choose what they want from lists, press Run, and a table of results comes back.
-
Run Report
For everyone. Choose a report, say what you want to see, press Run.
-
Report Admin
For whoever looks after reports. Decides what Run Report offers.
-
ERD Designer
A drawing of the tables and how they connect. Every report starts from it.
Run Report
The screen most people use. Every report it runs answers three questions.
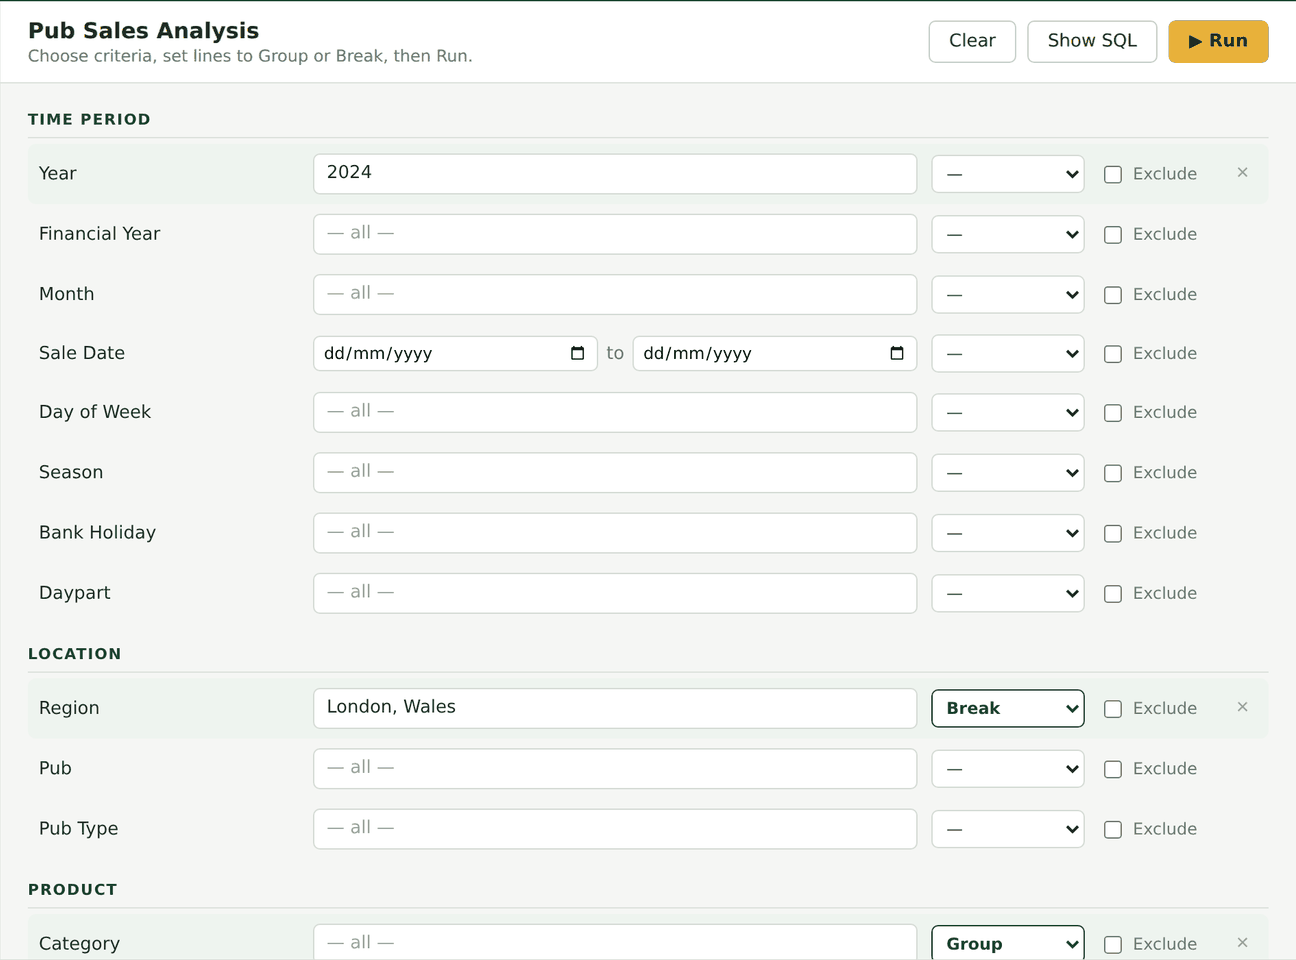
Which records do I want?
Click a line and tick values in a pick list, or give a date range. A long list shortens as you type. Tick Exclude and your choice means everything except those.
How should they be split up?
Set a line to Group and it becomes a column, with a row for each value. Set it to Break and you also get a subtotal each time the value changes.
Which numbers do I want to see?
Measures are the numbers a report brings back, such as units or net sales. Switch each one on or off. Options are tick boxes with plain names, such as “Active products only”.
The answer comes back as a table
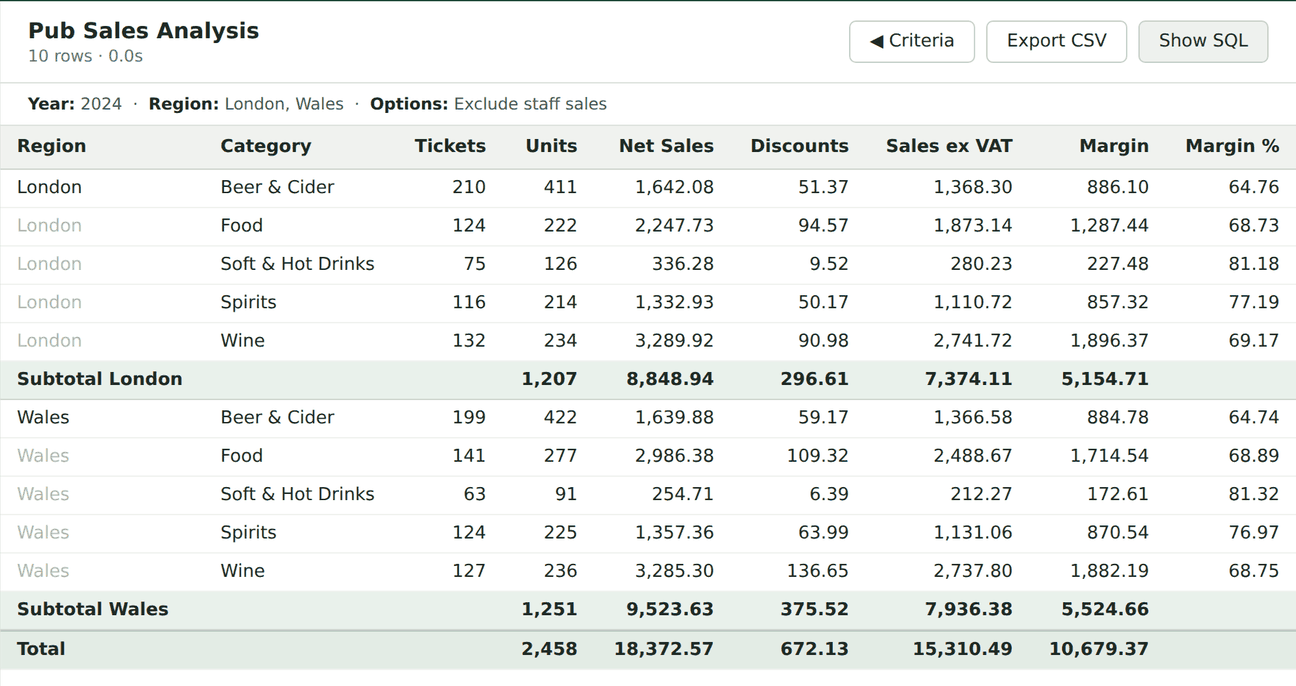
Press Run and the choices are replaced by results, with subtotals where you asked for them and a total at the bottom.
It says what it counted
Your criteria and ticked options are printed above the table, so the numbers always come with their context.
Sort by any column
Click a heading to sort by it. Click again to reverse, and a third time to put the rows back.
Totals that make sense
A percentage cannot be added up, so its total is left blank rather than filled with a wrong number.
Take it further
Export CSV downloads the table as a file that Excel opens. Show SQL displays the exact question that was sent to the warehouse.
The same report on a phone
Run Report rearranges itself to fit a narrow screen.
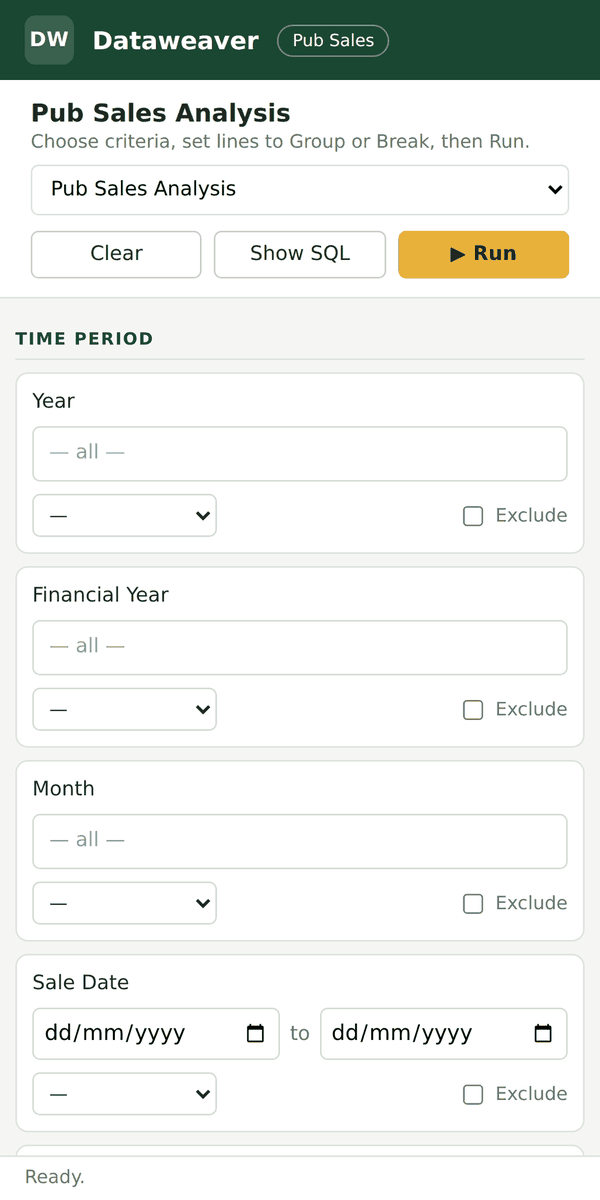
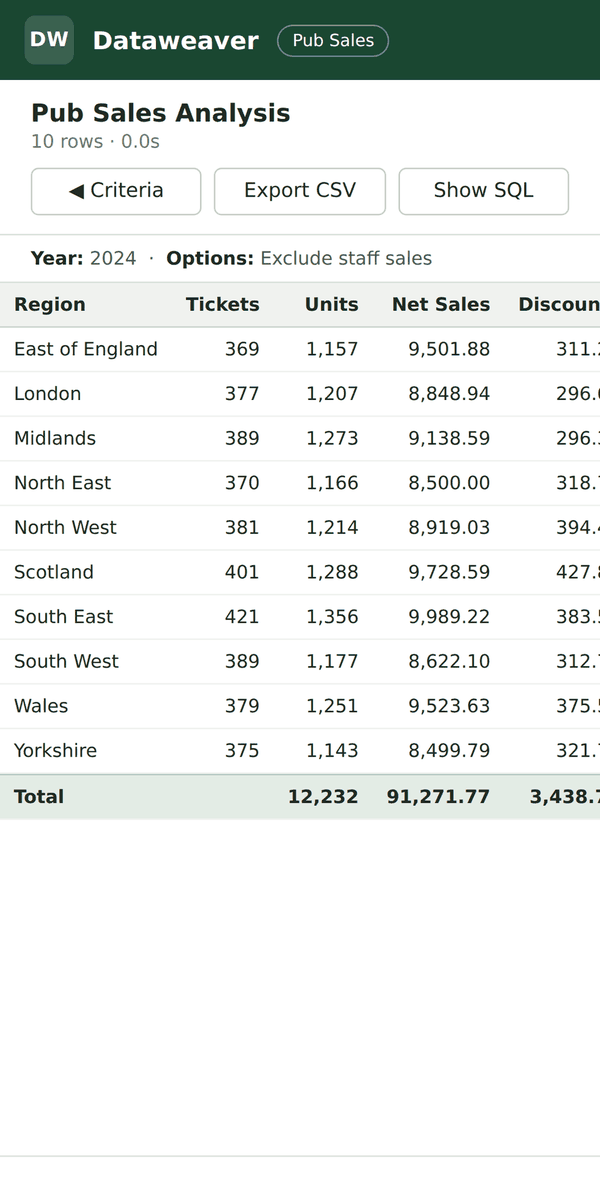
Each line becomes a card. The list of ready-made reports becomes a drop-down at the top. A wide table of results slides sideways under your finger.
Nothing is left out. Everything that works at a desk works the same way here.
Report Admin
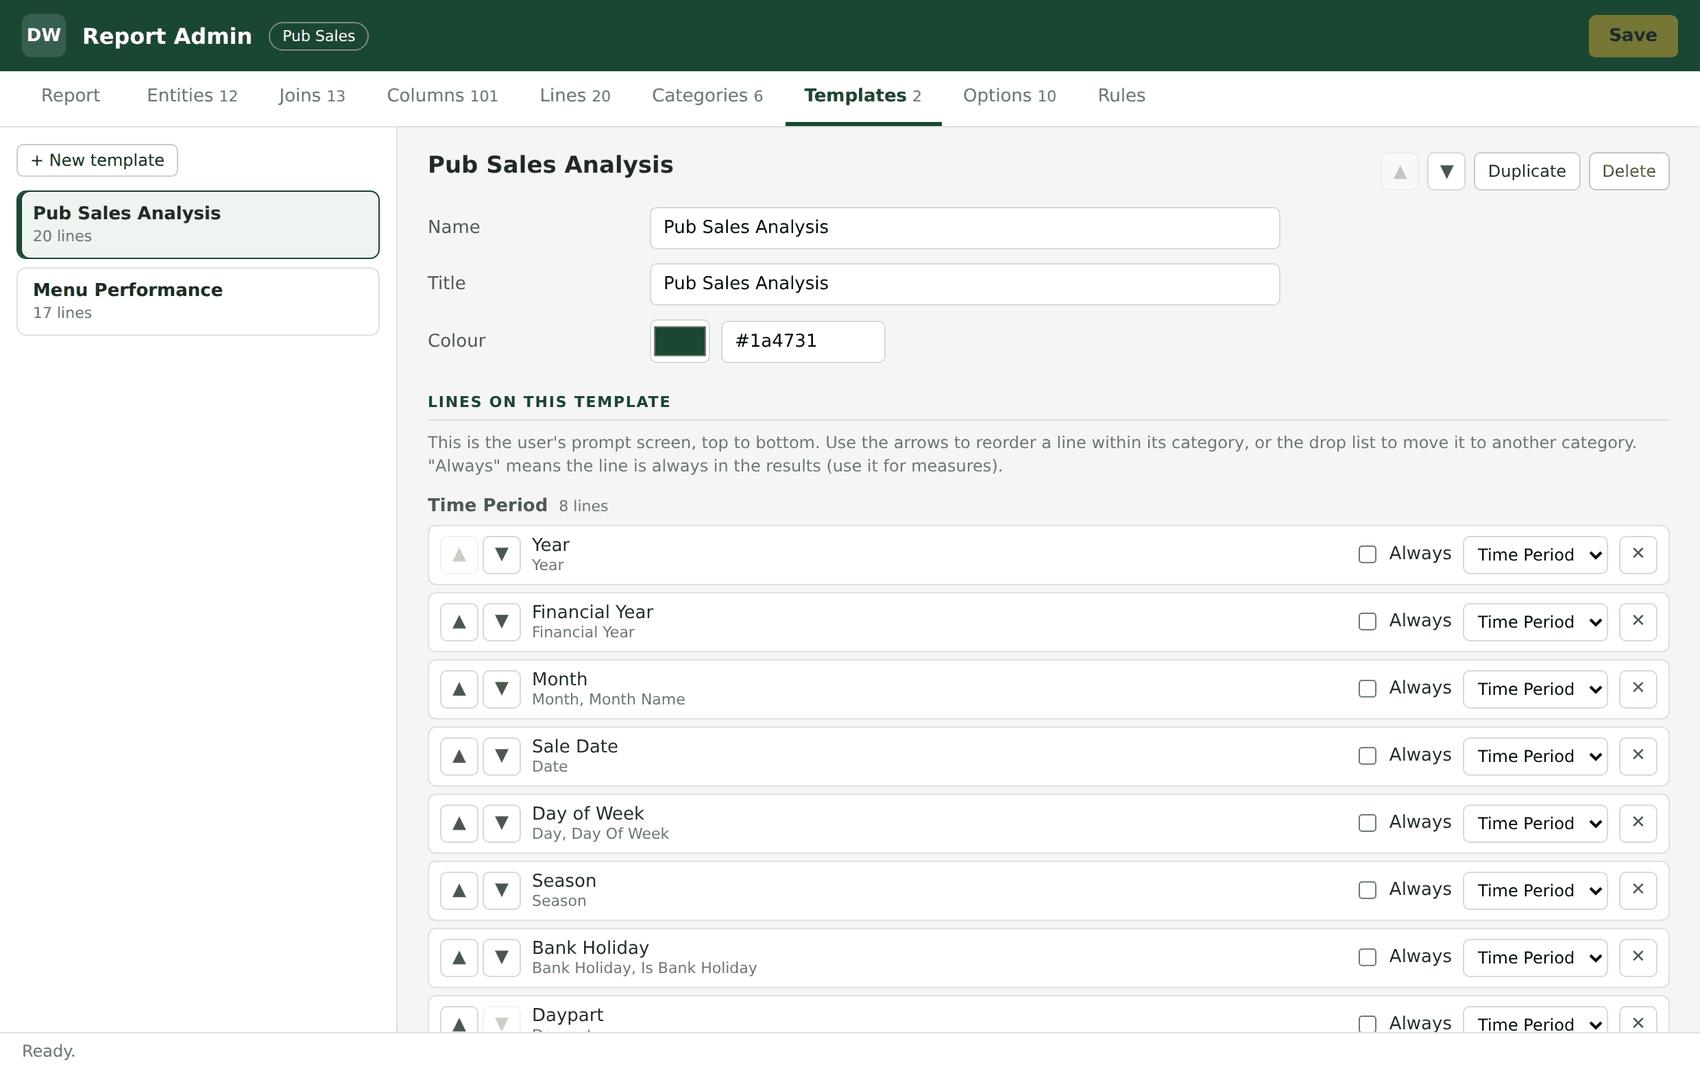
For the person who looks after reports. It decides what the Run Report screen offers, so everyone else only ever sees plain names and sensible choices.
Plain names
Give tables and columns the names your people use. Add calculated columns of your own, such as a margin percentage.
Ready-made reports
A template is a finished Run Report screen: chosen lines under chosen headings. One report can offer several.
Tick boxes and safeguards
Add tick boxes for common conditions. Add a rule that a report must be narrowed down before it runs, so nobody fetches the whole warehouse by accident.
Hard to break
Nothing is kept until you press Save. Report Admin changes one thing only, the report file, and never the warehouse.
ERD Designer
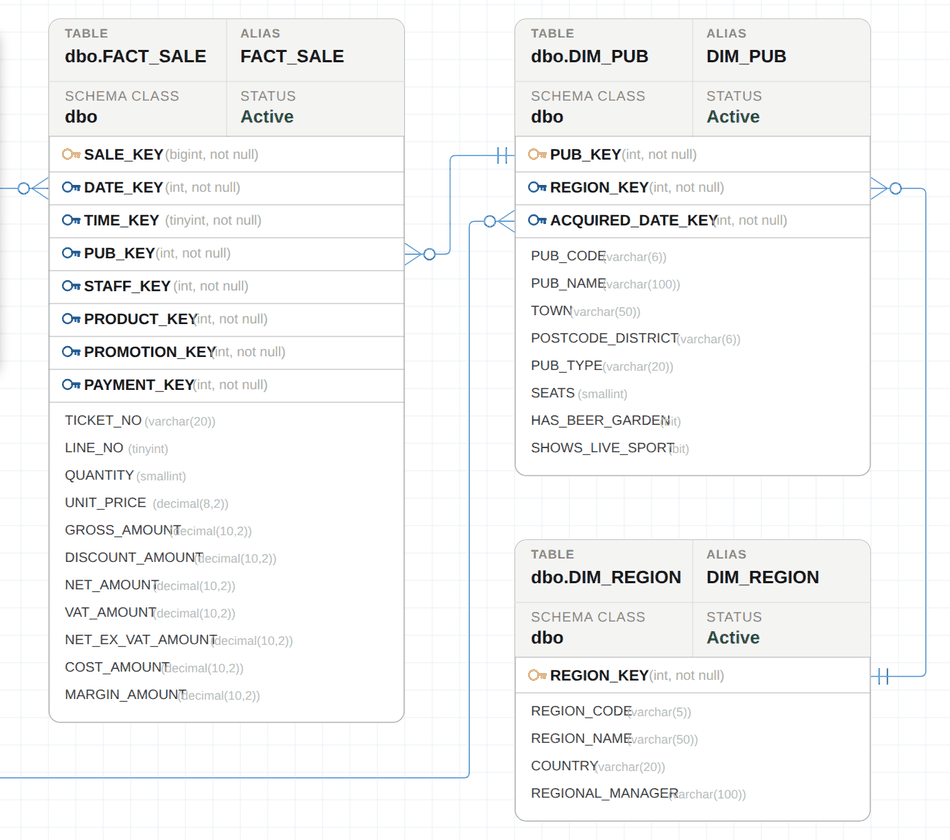
Every report starts from a drawing of the tables it uses and how they join.
Tables are placed on a diagram and the joins between them confirmed. That is done once, by someone who knows the data. From then on DataWeaver follows the joins outwards from the table of things that happened, such as sales, to reach whatever a report needs.
Diagrams change as reports grow. Add a table and it appears in Report Admin, ready to use. Remove one by mistake and put it back, and Report Admin re-links everything that depended on it and tells you what it did.
Where it sits
On your own servers
DataWeaver is installed where your warehouse is. Your data stays with you.
Read-only
DataWeaver only ever reads the warehouse. It cannot change what is in it.
One report, one file
Everything about a report, its diagram and its settings, is kept in a single file.